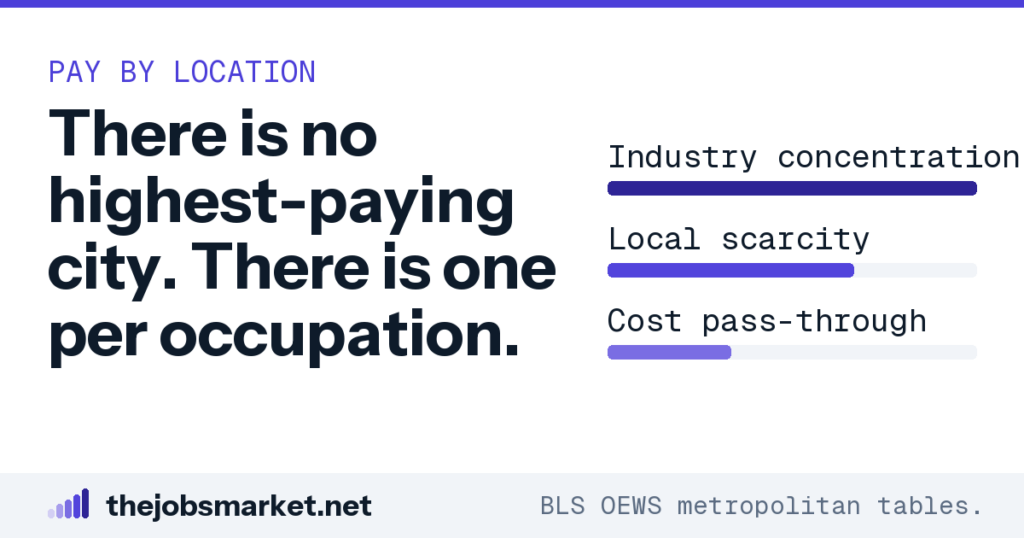
There is no single list of highest-paying cities, because the ranking is different for every occupation. A metro that leads for one kind of work sits mid-table for another, since local pay is set by which industries cluster there rather than by general prosperity. Read the metropolitan table for your own occupation code and ignore the generic city rankings entirely.
There is no highest-paying city
Every year a list appears ranking the best-paying cities in America, and it is close to useless for anybody making an actual decision. The ranking is different for every occupation, because local pay is set by which industries cluster in a place rather than by general prosperity. A metro that leads for one kind of work sits mid-table for another. The only list that matters to you is the one for your own occupation code.
The size of the effect justifies the trouble of looking it up. Across 302 occupations with a reliable sample in at least thirty metros, the best-paying metro pays a median of 2.29 times the worst. Registered nurses run 5.79 times, from $37,460 in Arecibo to $216,740 in San Jose. Waiters and waitresses run 5.47 times, from $15,080 to $82,550, which is the same job title and utterly different economics.
Three things set a local wage, in order
Industry concentration does the most work. Where a cluster of employers competes for the same skill, they bid against each other and the local rate rises above what the work would command elsewhere. That is why technology pay in a few metros looks unlike technology pay anywhere else. The cluster is the cause and the salary is the symptom.
Local scarcity is second and it operates in the opposite direction. A place that needs a skill and cannot attract it has to pay up until people arrive, which produces high pay without any cluster at all. Rural healthcare premiums are the clearest example of this shape. High pay with low concentration is usually scarcity rather than a boom.
Cost pass-through is third and it is much weaker than the conversation suggests. Expensive cities do have to offer more to recruit, and that pressure is real but partial. Assuming a high salary is simply an expensive city paying for itself will mislead you in both directions. The evidence for its weakness is in the next section.
The occupations geography barely touches
Postal service mail carriers vary by only 1.19 times across 109 metros, from $55,610 in Columbia to $66,440 in Oxnard. Mail sorters run 1.35 times. Those people live in the same expensive and cheap cities as everybody else, and their pay barely notices. The reason is that federal pay scales are set nationally with limited locality adjustment.
When one payer applies one schedule, geography stops mattering almost entirely. That is the cleanest demonstration available that local pay gaps are about local labor markets rather than local costs. If cost of living drove wages directly, a mail carrier in an expensive metro would be paid like the other workers there. They are not, and the gap barely moves.
Where the biggest premiums are
Healthcare and medical teaching show the widest ranges of anything measured. Health specialties postsecondary teachers run 7.29 times, family medicine physicians 6.92 times, and physicians in the residual category 6.86 times. Registered nurses at 5.79 times are the largest occupation on that list by a wide margin. These are not niche categories.
Part of that reflects genuine local scarcity and part reflects broad occupational codes covering different specialties in different places. Both explanations are real and they point at the same practical conclusion. For these occupations, where you practice matters more than almost anything else you control. A move can be worth more than a decade of progression.
State figures always understate the range
Registered nurses run 1.82 times across states, from $77,080 in Alabama to $140,270 in California, against 5.79 times across metros. General and operations managers run 2.35 times across states, from $74,050 in Arkansas to $173,690 in New Jersey. Retail salespersons run 1.38 times across states and 2.01 times across metros. In every case the state figure is the narrower one.
That happens because a state average blends its expensive and cheap metros into a single number. The range you would actually face is a range between places you might actually live, and those are metros. Use the metro figure wherever it exists and treat the state figure as a fallback. The difference between them is not small.
Retail is the control case
Retail salespersons run 2.01 times across metros, from $21,950 to $44,220, which sits below the 2.29 median. Where minimum wage rules do much of the price-setting and the work is standardized, geography compresses. The floor is legislated rather than negotiated, so the bottom cannot fall as far. That single mechanism explains most of the compression.
Hold that contrast in mind when reading any geographic comparison. High-variation occupations are ones where local demand for a scarce skill sets the price. Low-variation ones are where a legal floor or a national scale does. Knowing which kind you are in tells you whether a move is a strategy or a distraction.
The check I had to run on my own numbers
An unfiltered version of this comparison threw up first-line fire supervisors at 25.86 times, from $24,450 to $632,190. That is not a finding and it should not have survived a moment’s thought. The extremes came from metros holding around a hundred people in the occupation, where one unusual employer moves the whole median. A single outlier employer can produce a number that looks like a discovery.
Restricting the comparison to metros holding at least five hundred people in the occupation brings it to a sane 2.90 times. Every figure quoted here uses that filter, which is why they are trustworthy and why they are lower than some published comparisons. If a geographic claim you meet elsewhere shows an implausible extreme, suspect the sample before believing the number. Thin cells produce dramatic ratios and no information.
How to look up your own
Find your occupation’s median in your current metro and in two or three metros you would realistically move to. Compute the ratio between the best and the worst of them. That is fifteen minutes of work and it answers a question most people carry around unanswered for years. It also tells you whether the rest of this exercise is worth doing.
Under about 1.5 and geography is not your lever, so put the effort into employer type or specialization instead. Around 2.3 and you are typical, which means a well-chosen move is worth about as much as a substantial promotion. Above 3 and relocation is potentially the largest pay decision available to you, larger than anything you are likely to negotiate. The ratio decides which of those three conversations you should be having.
What the premium does not tell you
It does not tell you whether the gap survives housing costs and state income tax, which is a separate calculation with your own numbers in it. Regional price parities from the Bureau of Economic Analysis are the instrument for the first part, and a payroll calculator handles the second. Neither is built into any salary figure you will read. That work is yours and it changes the answer materially.
It also does not tell you whether the market is deep. A high median in a metro with two hundred people in your occupation is a thinner proposition than a lower median in a metro with twenty thousand. The second one has somewhere to go if the job ends and the first does not. Check the employment count next to the median, every time, before treating a high figure as an opportunity.
Common questions
Which city pays the most?
There is no single answer. The ranking is different for every occupation, because local pay is set by which industries cluster there rather than by general prosperity.
Why do generic city pay rankings mislead?
They rank area medians, which measure the mix of occupations concentrated in a place as much as what any particular occupation pays there.
Does the ranking change after cost of living?
Substantially. The metros at the top of most occupational rankings are also near the top of the price rankings, so the adjusted list is materially different.
Can a small metro out-pay a large one?
Regularly, for specific occupations, where one dominant employer or clustered industry bids for the same people. They never appear in generic rankings.
How do I find the list for my occupation?
Find your occupation code and open the metropolitan table for it, then apply the local price level and state tax to the top few before drawing any conclusion.
How much does pay vary between metros?
About 2.29 times between the highest and lowest metro for a typical occupation. Registered nurses run 5.79 times, from $37,460 to $216,740.
Which occupations barely vary by location?
Postal service mail carriers, at 1.19 times, because federal pay scales are set nationally with limited locality adjustment.
Why do some published geographic comparisons look absurd?
They omit a minimum-employment filter. Unfiltered, fire supervisors appear to vary 25.86 times; restricted to metros with 500+ in the occupation it is 2.90.